

Flipping Profit Margins Continue to Shrink in 2025
The U.S. home flipping market saw a significant slowdown in early 2025, as both activity and investor profits declined sharply, according to ATTOM’s newly released Q1 2025 U.S. Home Flipping Report.
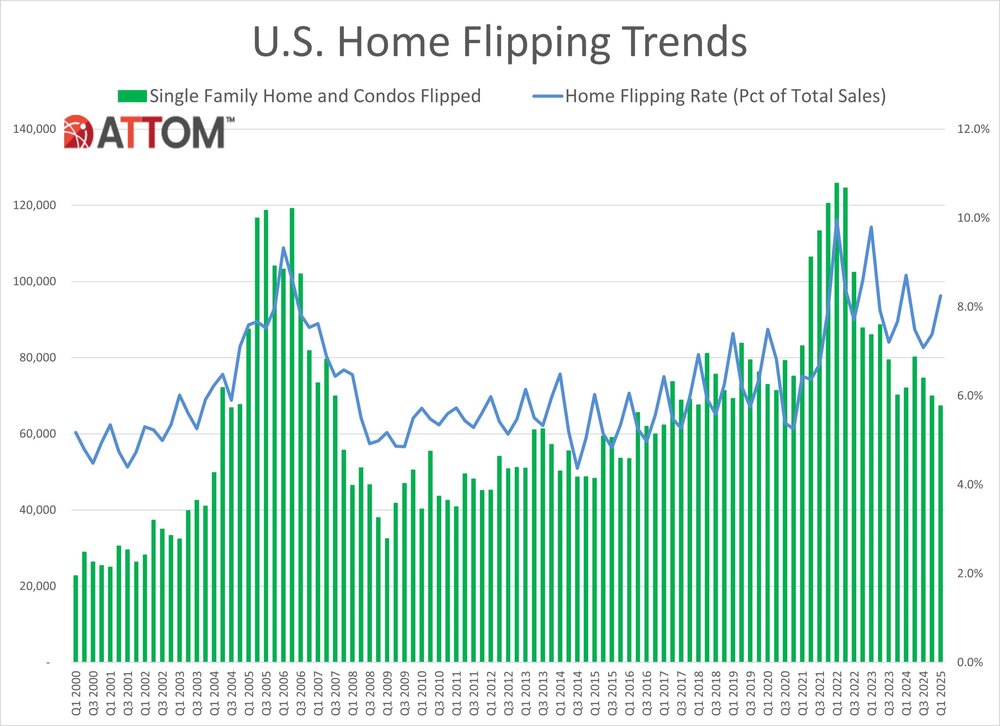
A total of 67,394 single-family homes and condominiums were flipped in the first quarter, representing 8.3% of all home sales between January and March. While that marks an increase from 7.4% in Q4 2024, it reflects a slight dip from 8.7% in the same period last year. The latest volume also represents the lowest quarterly flip count nationwide since 2018.
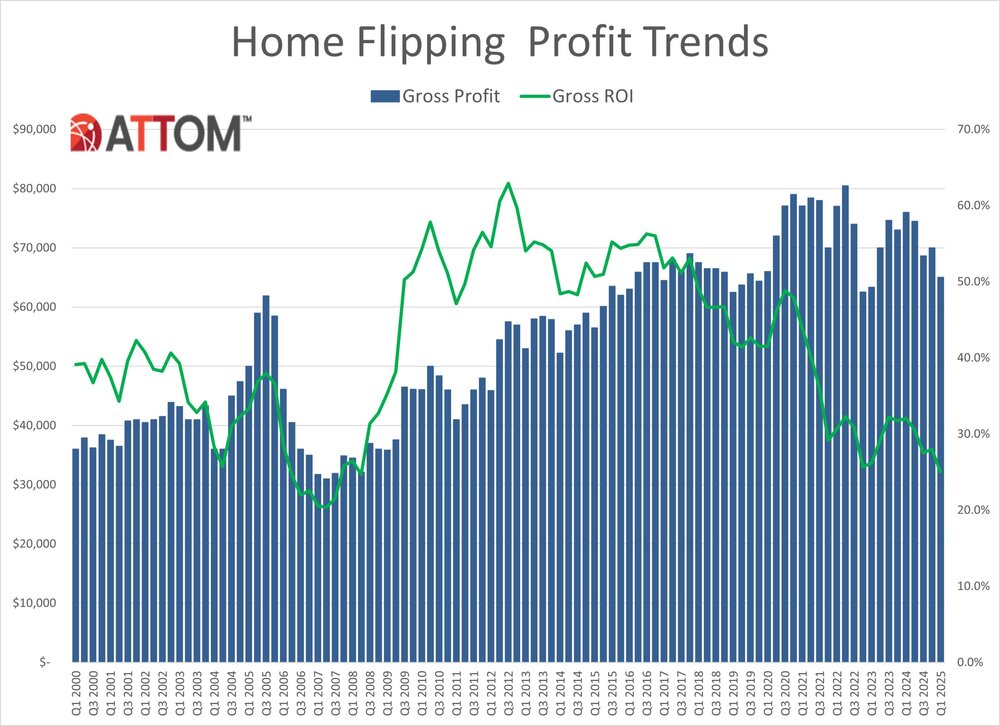
Despite high home prices, investors are facing tighter margins. The typical gross profit on a flipped home dropped to $65,000 in Q1 2025–down from $70,000 in the prior quarter–on a median resale price of $325,000 and a median purchase price of $260,000. That equates to a 25% return on investment (ROI) before expenses, continuing a downward trend from the post-pandemic peak ROI of nearly 49% in late 2020.
“The competitive home market means high prices, which is good for short-term investors on the selling end,” said Rob Barber, CEO of ATTOM. “But that dynamic is also making it harder to find underpriced homes to buy up and it’s ultimately squeezing profit margins for the industry.”
Barber added, “Investors don’t want to buy a property when prices are high and then see them drop before they’re ready to sell. It’s tricky to balance at times when the market looks like it could take a downturn.”
Regional Trends and Flipping Hotspots
While 76% of the 173 metro areas analyzed saw quarter-over-quarter gains in flipping activity, two-thirds reported annual declines. Macon, GA topped the list of flipping activity with flips making up 21% of home sales, followed by Warner Robins, GA (20.6%), Atlanta, GA (15.9%), Memphis, TN (14.7%), and Akron, OH (13.3%).
Among major metros (population 1 million+), Birmingham, AL (12.8%), Kansas City, MO (11.6%), and Salt Lake City, UT (11.1%) had some of the highest flipping rates. Conversely, Honolulu, New Orleans, Seattle, Pittsburgh, and Portland reported the lowest shares, ranging from 4.7% to 6.1%.
Profitability Declines in Majority of Markets
More than half of U.S. metro markets saw declining profit margins in Q1, with 63% (109 out of 173 metros) showing year-over-year drops. Among the steepest quarterly ROI declines:
- Spartanburg, SC: ROI fell from 160.2% to 31.3%
- Ocala, FL: 125% to 50.6%
- Chattanooga, TN: 125.6% to 81.3%
- Lynchburg, VA: 69.2% to 31%
- Johnson City, TN: 82.1% to 44.5%
Among large metros, St. Louis, MO saw margins fall from 49.3% to 27.3%, while Fresno, CA, Pittsburgh, PA, New York City, and Chicago, IL also posted double-digit declines.
Only 26% of analyzed markets had typical ROI above 50%. Top performers included Buffalo, NY (102.1%), Pittsburgh, PA (100.4%), and Scranton, PA (89.9%).
By contrast, high-cost cities like Austin, TX (1% ROI), Dallas (3.7%), and Houston (5%) had the weakest margins.
Flippers Gravitate to Lower-Priced Markets
The most profitable flips occurred in markets where homes were acquired for less than $225,000, with median ROIs of 46.4%. Mid-range markets ($225,000-$400,000 purchase prices) yielded 22%, while higher-end markets (>$400,000) delivered just 19% returns.
Cash Purchases and Turnaround Times
Cash remains king in the flipping sector. Nationwide, 62.2% of flipped homes were bought with all-cash in Q1, slightly down from 63.4% last quarter. Cities like Rockford, IL; Buffalo, NY; and Naples, FL saw cash purchases exceed 81%.
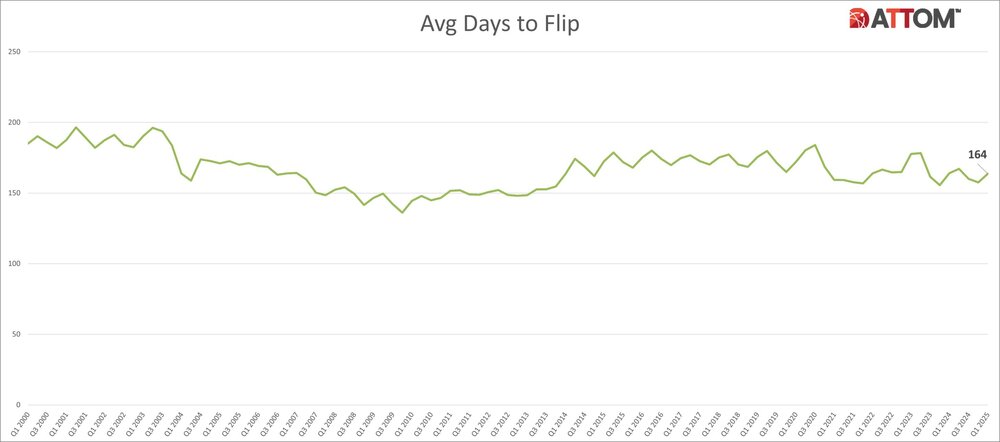
Average time to complete a flip increased modestly to 164 days, up from 157 days in Q4 2024 but still below 2023 levels.
FHA-Backed Sales and County-Level Activity
Roughly 10.9% of flipped homes were sold to buyers with FHA loans in Q1 2025–up from 10.5% last quarter. California and Florida metros such as Visalia, Bakersfield, and Lakeland had the highest FHA buyer rates.
At the county level, flips accounted for over 10% of sales in 27.1% of the 885 counties analyzed. Top counties included Cobb County, GA (25.9%) and Dawson County, GA (23.4%).
Sign Up Free | The WPJ Weekly Newsletter
Relevant real estate news.
Actionable market intelligence.
Right to your inbox every week.
Real Estate Listings Showcase
Please visit:
Our Sponsor