
Executive Summary (TL;DR)
- The legal U.S. cannabis map stands at 24 adult-use states and 40 medical states (plus D.C. and select territories) as of mid-2025; your real estate and licensing strategy should reflect that patchwork.
- Industry size varies by methodology, but credible sources place 2023 retail sales around $28.8B, 2024 projections between $31.4B and >$38B, and 2025 total economic impact at ≈$124B.
- Zoning, buffers, and retail caps remain the gating constraints on expansion; underwriting must start with local Authority Having Jurisdiction (AHJ) rules.
- Section 280E still applies until a final federal rescheduling rule is adopted; model taxes accordingly.
- To act on today’s opportunities, begin with site feasibility and deal flow. Start screening cannabis listings and compliant properties.
Table of Contents
- Why these numbers matter
- Snapshot 2025: legalization map at a glance
- Timeline: the 10 most important dates since 1970
- Market size, jobs, and economics
- What the numbers mean for real estate: zoning, buffers, and site selection
- Licensing & compliance milestones that move deals
- Store-level KPIs operators actually track
- Myth vs. Fact
- Decision matrix: expand, relocate, or acquire
- Action plan & next steps
Why These Numbers Matter
Numbers drive every decision—where to expand, whether to lease or buy, how to value a target, and when to stage capital. But cannabis data are often jurisdiction-specific, time-sensitive, and method-dependent. This overview distills key dates and stats operators and investors use to evaluate feasibility, risk, and upside—especially around zoning, buffers, and location requirements that ultimately decide whether a parcel can host a licensed cannabis use. For current, real-world opportunities, review live cannabis real estate and business listings.
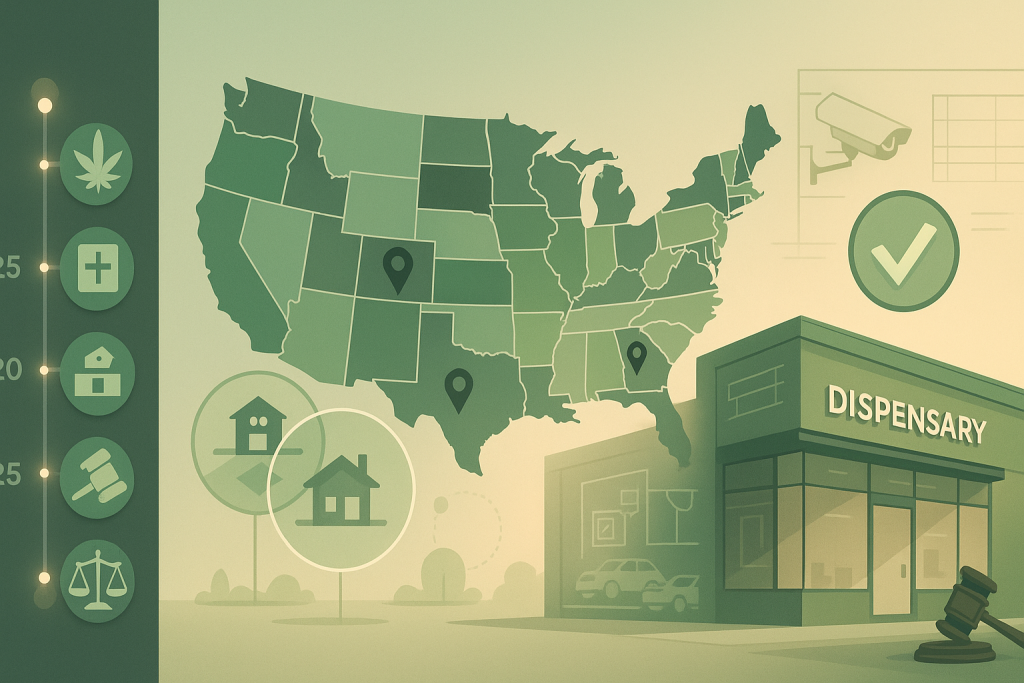
Snapshot 2025: Legalization Map at a Glance
- Medical cannabis: 40 states (+ D.C., + 3 territories) permit medical use.
- Adult-use (non-medical) cannabis: 24 states (+ D.C., + 3 territories) permit adult use.
- Implication: Expansion capacity and investment theses hinge on local zoning overlays, license caps, and retail coverage—not only statewide legalization.
- Rescheduling status: A federal rulemaking to move cannabis from Schedule I to Schedule III advanced in 2024; until a final rule is published, 280E still applies.
Sources listed at the end; no external links appear in the body.
Timeline: The 10 Most Important Dates Since 1970
| Year/Date | Event | Why It Matters to Operators |
|---|---|---|
| 1970 | Controlled Substances Act (CSA) enacted; cannabis placed in Schedule I. | Sets the federal baseline and triggers tax code §280E consequences. |
| 1996 (Nov 5) | California Proposition 215 (Compassionate Use Act) — 1st modern state medical law. | Establishes a state-regulated path to medical use; signals the start of state–federal divergence. |
| 2012 (Nov 6) | Colorado Amendment 64 and Washington I-502 approved. | First adult-use legalization; creates the current dual (medical vs. adult-use) market structure. |
| 2014–2015 | DOJ guidance era wanes and is later rescinded in 2018. | Federal prosecutorial discretion narrows; state compliance remains crucial. |
| 2018 (Dec 20) | Farm Bill legalizes hemp ≤0.3% Δ-9 THC. | Creates the hemp supply chain and intoxicating hemp derivative issues that impact licensed retail demand. |
| 2020 (Aug 21) | DEA IFR: synthetically derived THC remains Schedule I. | Clarifies that some hemp-derived intoxicants stay controlled; enforcement affects category mix. |
| 2022–2024 | New adult-use states (e.g., MD, MO, RI, MN, OH, among others). | Expands retail footprints; shifts regional demand and cross-border traffic. |
| 2023 (full year) | U.S. regulated sales ≈ $28.8B; jobs rebound. | Indicates stabilization after 2022 compression; hiring resumes in growth markets. |
| 2024 (rulemaking) | DOJ/DEA move to reschedule to Schedule III enters rulemaking. | If finalized, would materially change §280E exposure; not final as of mid-2025. |
| 2025 (Jun 26) | 40 medical states; 24 adult-use states. | Confirms the market’s breadth; feasibility still determined AHJ-by-AHJ. |
Market Size, Jobs, and Economics
Methodology matters. Sales totals and job counts differ by whether analysts include only state-regulated channels, how they treat hemp-derived intoxicants, and which states release complete data. Consider the range, not a single point estimate.
Current Benchmarks (best-available, sourced)
| Metric | Value / Range | Notes |
|---|---|---|
| 2023 U.S. regulated sales | ≈$28.8B | Vangst/Whitney based on state-reported retail; hemp derivatives excluded. |
| 2024 U.S. sales (projection) | $31.4B to >$38B | Lower bound Vangst/Whitney; upper bound BDSA retail forecast. |
| 2025 total U.S. economic impact | ≈$123.6B | MJBiz Factbook estimate (includes indirect/induced effects). |
| Legal cannabis jobs (early 2024) | ≈440,445 FTE | Employment rebounded; concentration in MI, MO, NJ, MD, etc. |
| Adult-use states (mid-2025) | 24 states + D.C. + 3 territories | Adoption expanding; retail rollout pace varies by AHJ. |
| Medical states (mid-2025) | 40 states + D.C. + 3 territories | Policy scope, qualifying conditions, and product rules differ. |
Practical takeaways
- Growth is state-staged: new markets and improved access (hours, delivery, density) drive gains; mature western markets still manage price compression.
- M&A is opportunistic: distressed assets (licenses, brands, retail clusters) trade where zoning and caps favor consolidation.
- Financing aligns with permitting milestones: lenders underwrite to CUP approvals, final inspections, and track-and-trace onboarding.
When your underwriting calls for real properties and live deals, compare licensed businesses and lease-compliant sites.
What the Numbers Mean for Real Estate: Zoning, Buffers, and Site Selection
Licensing lives and dies on the parcel. Before LOI or PSA, test sites against local zoning and sensitive-use buffers (schools, daycares, youth centers, parks, libraries). Distances and measurement points (front door vs. parcel line) vary by AHJ and often decide feasibility.
Core diligence checklist
- Use & zone fit: Retail, cultivation, manufacturing, distribution each map to specific zones; confirm overlays and any moratoria.
- Buffers & density controls: Validate required separations from sensitive uses and from other cannabis retailers; check retail caps and lottery status.
- Access & parking: Minimum stalls, ADA compliance, curb cuts, and circulation for peak traffic; some AHJs require queue management plans.
- Power & mechanicals: Confirm service (often 3-phase for production), HVAC, and odor mitigation; document loads for lighting, refrigeration, and security.
- Security plan: Cameras, alarm monitoring, vault/safe specs, evidence-of-storage practices, lighting, sight-line controls.
- Signage & storefront: Window coverage limits, frosted glass rules, and exterior sign restrictions.
- Environmental & waste: Hazardous waste handling (extracts/solvents), wastewater pre-treatment, and disposal vendors.
- Lease terms: Cannabis addendum, assignment rights, option to purchase/extend, TI allowance, contingencies keyed to license phases.
- Community relations: Public notices/hearings, good-neighbor policies, equity commitments; local support influences permit outcomes.
Pro move: Build a site-screening grid that flags any parcel failing a single rule. Then source alternates. To find candidate sites, review lease-compliant properties and cannabis greenhouses for sale.
Licensing & Compliance Milestones That Move Deals
Licensing pathways typically sequence local approval → state provisional → inspections → final, but labels differ by state. Track these gates against your capital plan:
- Zoning confirmation (written) and CUP/SUP (Conditional/Special Use Permit) intake.
- Public notice & hearings; resolve objections early.
- Security, odor, and operations SOPs submitted with premises diagram.
- Track-and-trace (e.g., METRC/BioTrack) credentials issued; reconcile test invoices and intake logs.
- Final inspection (local and state); punch list completion.
- Certificate of Occupancy / Fire sign-offs; verify egress, sprinklers, vaulting, and alarm integration.
- Operational readiness: POS tax settings, inventory SOPs, and COA verification workflow.
Financing note: Many lenders fund in tranches at each milestone. Structure reserves for TI, security, and working capital during pre-revenue months.
Store-Level KPIs Operators Actually Track
Averages are noisy, but disciplined operators monitor:
- Traffic & coverage: daily visits, radius capture vs. competitors, delivery penetration.
- Basket dynamics: average order value; mix shift (flower vs. edibles vs. beverages vs. vapes).
- Turns & shrink: SKU-level sell-through, days on hand, and loss/theft rate; reconcile to track-and-trace.
- Labor & service: labor % of sales, queue times, repeat-visit rate.
- Compliance: ID scan pass rate, COA completeness, variance resolution time.
- Real estate productivity: sales per rentable square foot; rent + NNN as % of sales.
Tie KPIs to your local rule set. For example, limited hours or delivery bans depress traffic; higher retail caps may fragment demand.
Myth vs. Fact
- Myth: “If my state is legal, any C-1 or retail zone works.”
Fact: Many AHJs impose additional overlays, buffers, and caps. A parcel may be in a retail zone and still be ineligible. - Myth: “Rescheduling means 280E is over now.”
Fact: Until a final rule is published, §280E remains in effect, per the IRS. Model taxes accordingly. - Myth: “A booming state headline guarantees store-level profits.”
Fact: Site selection and density drive unit economics; price compression in mature markets can offset volume gains. - Myth: “Any hemp shop can quickly convert to licensed retail.”
Fact: Zoning, buffers, hearings, and TI often require months; many sites will fail one or more feasibility checks.
Decision Matrix: Expand, Relocate, or Acquire
| Starting Point | Market Conditions | Best Move | Rationale |
|---|---|---|---|
| Single store, underserved submarket | Retail caps tight; strong inbound traffic | Expand (2nd site or delivery hub) | Capture marginal demand before competitors; leverage brand loyalty. |
| Multi-store operator with uneven comps | New AHJ opens limited licenses | Relocate or swap a weak site | Shed underperforming rent; redeploy to superior zoning/visibility. |
| Capital-light operator | Distressed licenses/brands at discount | Acquire targeted assets | Accelerate footprint and SKU fill with lower build-time risk. |
| Hemp retailer seeking compliance | Strict local enforcement; limited parcels | Partner with licensed operator | Speed to market via sublicensing/white-label and compliant premises. |
Action Plan & Next Steps
- Map the rules: Compile zoning tables, buffers, caps, and hearings for your target AHJs.
- Screen sites fast: Use a red-flag grid (fail any item → discard) before spending on engineering.
- Sequence capital: Align draws to CUP, build-out, and inspection milestones; reserve for TI/security.
- Build the compliance spine: COA intake, age-gating, variance resolution, traceability audits.
- Pressure-test the model: Run P&Ls under price compression and higher tax scenarios (280E still in effect).
- Source opportunities: Review licensed businesses on the market and lease-compliant properties to match your expansion thesis.
- Decide: Expand, relocate, or acquire—then execute with a permitting calendar and stakeholder plan.
Disclaimer
This article is for educational purposes only and does not constitute legal, engineering, financial, or tax advice. Always consult qualified professionals and your local Authority Having Jurisdiction before making decisions.
Please visit:
Our Sponsor